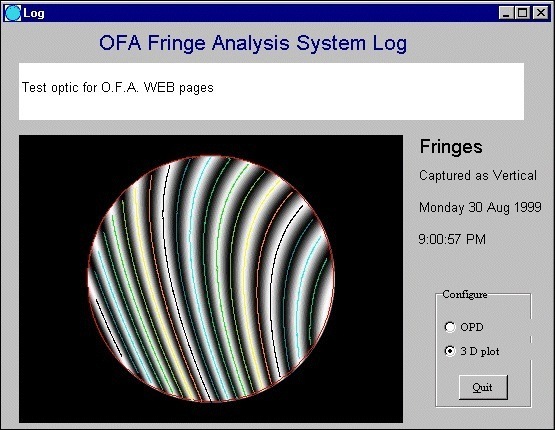
There is a free form comment entry box at the top of the sheet, followed by a range of analysis data which can be configured by the user as required. This includes the original video image with detected fringes superimposed (shown left), the OPD map, 3-D contour plot, etc.
Any Windows compatible output device may be used including laser and ink jet printers and plotters.
Alternatively, any Fringe Master screen can be captured into the clipboard and inserted as a bit mapped image into an application running under Windows.