Fringe Master reports the Peak to Valley (P-V) and r.m.s. figures of the OPD surface.
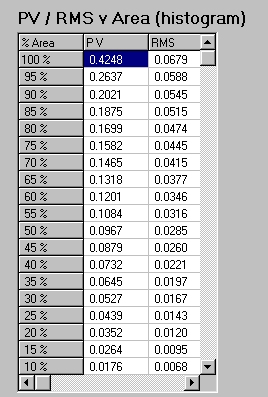
It also presents a histogram of P-V and r.m.s. data. This gives useful additional information; for example, in the case illustrated, it shows that although the overall P-V figure is 0.42 waves, 90% of the area of the test piece has a P-V better than 0.2 waves.
The information is available as a table, which can be printed or saved to disc, or displayed graphically.
Similar information is available as a function of radial distance from the centre of the test piece.