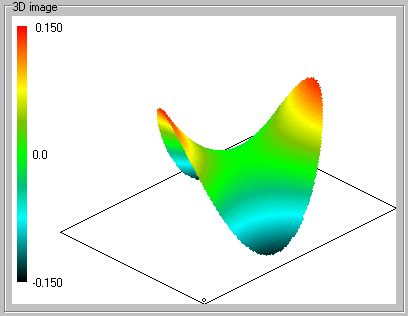
The software computes the deviation of the interferogram from the best fit reference plane. These deviations are interpolated over the 768 x 576 grid and presented as an Optical Path Difference (OPD) image.
The OPD can be displayed in 4 orthogonal 3-D views, exported to spreadsheets or saved in a data format suitable for input to ray tracing and beam propagation software.
Fringe-Master analyses the OPD in terms of P-V and r.m.s. deviation, r.m.s. histogram, Seidel and Zernike coefficients. The user can set the full scale OPD range in order to maximise the level of detail without over flowing the dynamic range of the system.
Built-in FFT routines enable the user to transform the OPD distribution to give the Point Spread Function (far field intensity distribution), Phase & Modulation Transfer Function (PSF & MTF) plotted in x & y directions.
Typical analysis time from image input to OPD calculation is 3 secs using a 350 MHz Pentium II P.C.